Developer tools for Cloud Run
In this article, we cover different useful tools you could use if you want to fully enjoy Cloud Run, like Debugger, Cloud Logging and Profiler.
Developer tools to enhance Cloud Run development
Cloud Run is the next generation of serverless solution offered by Google Cloud. It allows you to execute an OCI image (Docker image for instance) of your choice on Google Cloud servers.
For those familiar with App Engine Standard environment, the main difference is that Cloud Run gives you the choice of your app’s runtime environment. Usually, App Engine provides a set of runtimes (Java, Node, Python...) that your application can run on. It frees the developer from the burden of packaging the application and its runtime. However, it can’t run your app on the latest version of a runtime environment (like Java 16 for instance).
Using OCI images give you a lot of flexibility. But at what cost? You now need to provide such an image containing your application. A common way to do so is to create a Dockerfile that contains the instructions to containerize your application.
As developers, we like having access to some metrics, data or resources computation used by our application. In this article, we will go through how you can:
- Access your Cloud Run application logs
- Debug your applications on production without impacting performance
- Profile your applications to monitor CPU usage and other metrics
Cloud Logging - Check your application logs
Logs have always been an important aspect for an application whose lifetime is intended to be a couple of years. You need to keep in mind that one day, something will go wrong in your application. And when it does, you better be ready to investigate.
Logs are the go to place when an incident occurs on an application. And it makes sense. Being able to look for the root cause and gather information on what went wrong and how is invaluable.
The 12 factor apps (a set of best practices when developing containerized applications) states "[An application] should not attempt to write to or manage log files. Instead, each running process writes its event stream, unbuffered, to stdout". This means you should only focus on logging behaviours and data to the console. Leave log capture & aggregation to the Ops.
If you follow this principle, you can easily use Cloud Logging to monitor your Cloud Run services logs, aggregate them and define alerts, or custom metrics about your application.
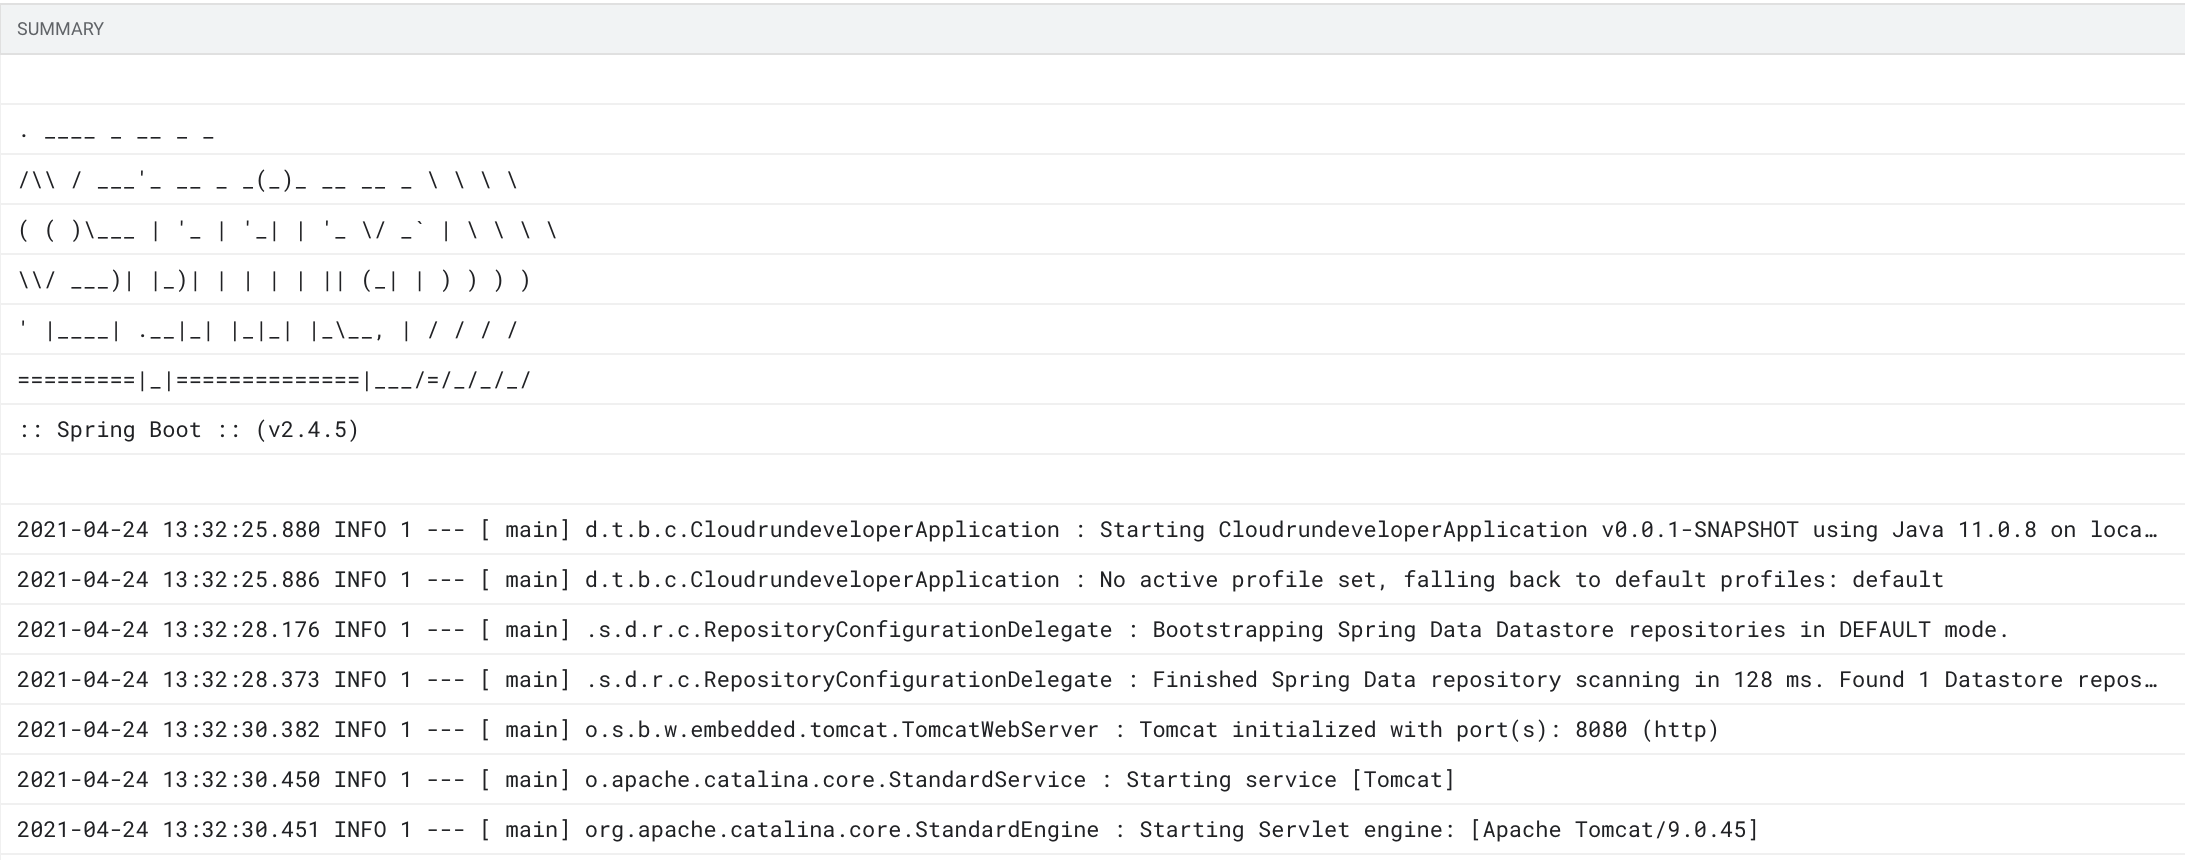
In this screenshot, we see the output for the
cloudrun-developer-00005-xuhrevision (a revision is an immutable running instance of your application). But we could filter for the Cloud Run servicecloudrun-developerfor instance, or all Cloud Run resources...
You do not have to log onto the server anymore, typing a tail -1000f /my/log/file.log or any command you were used to. You have a great Web Interface, collecting and showing the logs of all your services. Moreover, it is easy to apply filters to see the output of a specific Cloud Run service, or filter by Correlation-ID to track a transaction across all your services.
If you wish to access the global documentation about Cloud Logging and Cloud Run, here is the link.
Cloud debugger
I know, I know... My code is perfect, and there is no such thing as a "Bug"... So why bother using a Debugger in the first place...
As great and magnificent you and your code can be, I am sorry to break it to you, but you (of course, not me 😝) will face undesired behaviors in your application. When it happens, you will be happy to be able to debug your application easily.
What if I told you that there is a way. You can debug your application while it is running in production, with no impact on your user experience ? Sounds too good to be true, keep reading.
Cloud Debugger lets you inspect the state of your application by providing:
- The possibility to take snapshots of your code. If you run a Java application, you will see the stacktrace and the variables/parameters value.
- The possibility to create logpoints in your code. This logpoint will send a log in Cloud Logging when the user hits the logpoint. Following a specification, you can log existing variables or statements to help you monitor your application directly in production.
If you are familiar with App Engine, you might have already used the Cloud Debugger service of Google Cloud. Any AppEngine application can be linked to Cloud Debugger in order to debug your application while it is running. If you tried Cloud Run recently, maybe you realized this feature was not natively provided and you felt betrayed... Hold on ! It is still possible to enable it yourself.
Installing the Agent
An application deployed on App Engine includes an agent capable of interacting with Cloud Debugger. To benefit from the same functionality on Cloud Run, it is as easy as it sounds: you need to install the same agent in the OCI image you provide to Cloud Run.
Following this documentation, here is how you can install the agent:
# Create a directory for the Debugger. Add and unzip the agent in the directory.
RUN mkdir /opt/cdbg && \
    wget -qO- https://storage.googleapis.com/cloud-debugger/compute-java/debian-wheezy/cdbg_java_agent_gce.tar.gz | \
    tar xvz -C /opt/cdbg
Once installed, just add some variables to your java -jar command line:
CMD java \
   -Dcom.google.cdbg.breakpoints.enable_canary=true \
   -jar PATH_TO_JAR_FILE
Then, when running your Cloud Run service, you need to provide environment variables to complete the Debugger agent setup:
JAVA_TOOL_OPTIONS=-agentpath:/opt/cdbg/cdbg_java_agent.so
Using Source Repositories
To be able to create snapshots and logpoints, Cloud Debugger needs to have access to your source code. Cloud Debugger then displays your source code in the UI, and you just have to navigate to your code to create a snapshot or a logpoint.
A way to benefit from this functionality is to sync your github repository with Source repositories. Follow this link to do so.
Example of logpoints and snapshots
You can manage logpoints and snapshots through the Debugger service in Google Cloud. Once the Cloud Run service is deployed with the Debugger Agent, and Source Repositories sync with your code, you can simply use the Debugger service. If you want a step by step procedure, you can follow this link
Logpoints are points in the program that will send a log message into your service logs. These logs are collected by Cloud Logging as well, fitting nicely into your existing application logs. [To know how to create Logpoints, follow this link].(https://cloud.google.com/debugger/docs/using/logpoints#console)
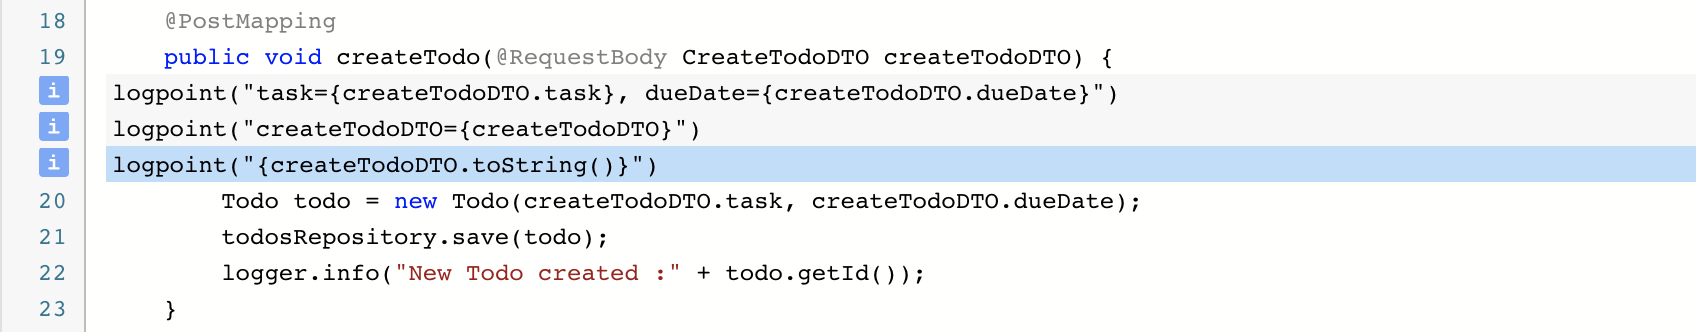
In this example, I created 3 logpoints in the same method of my Controller. When the user asks for a new Todo creation, the logpoint will be triggered and will send the message to Cloud Logging.
logpoint("task={createTodoDTO.task}, dueDate={createTodoDTO.dueDate}")
logpoint("createTodoDTO={createTodoDTO}")
logpoint("{createTodoDTO.toString()}")
You have to follow Google Cloud Logpoints specification for your logpoints to be included inside cloud logging (For now, I am not able to find the complete documentation...). Here is the result in Cloud Logging.
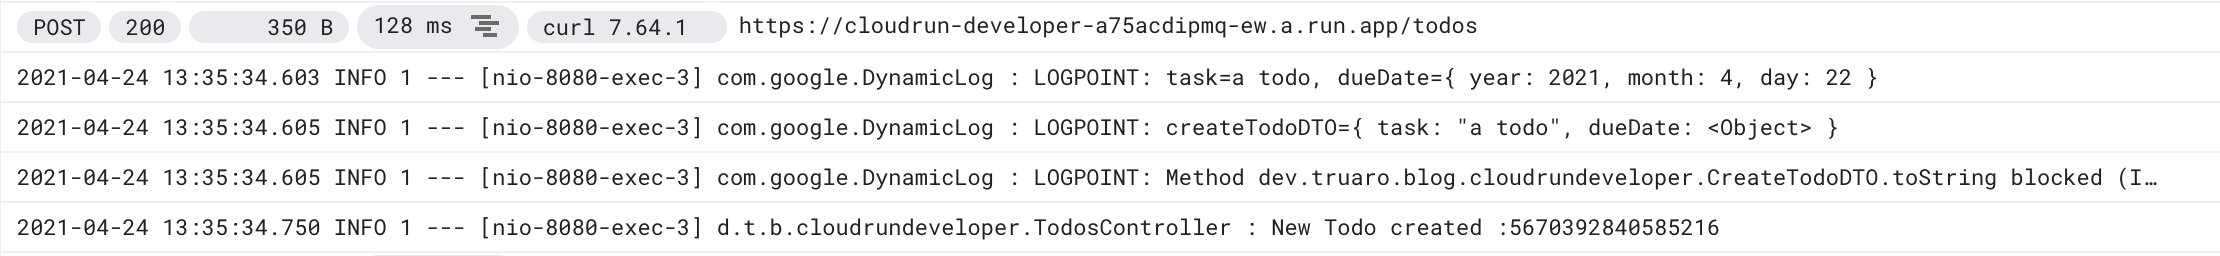
For Java, I noticed 2 interesting things:
- Logging object does not seem to perform a deep reflection
LOGPOINT: createTodoDTO={ task: "a todo", dueDate: <Object> }. Here, you see thedueDateis logged asobject. - You can't make any method call. The logpoint
createTodoDTO.toString()logged an error:LOGPOINT: Method dev.truaro.blog.cloudrundeveloper.CreateTodoDTO.toString blocked (INVOKEDYNAMIC instruction not supported)
A snapshot works in a similar way, but the output is different. Instead of seeing logs output, you can directly inspect the stacktrace, and the current state of the object in the scope (this, parameters, variables...). To have a step by step snapshot creation, follow this link.
In this example, I created a snapshot before calling the todoRepository. Here is the result:
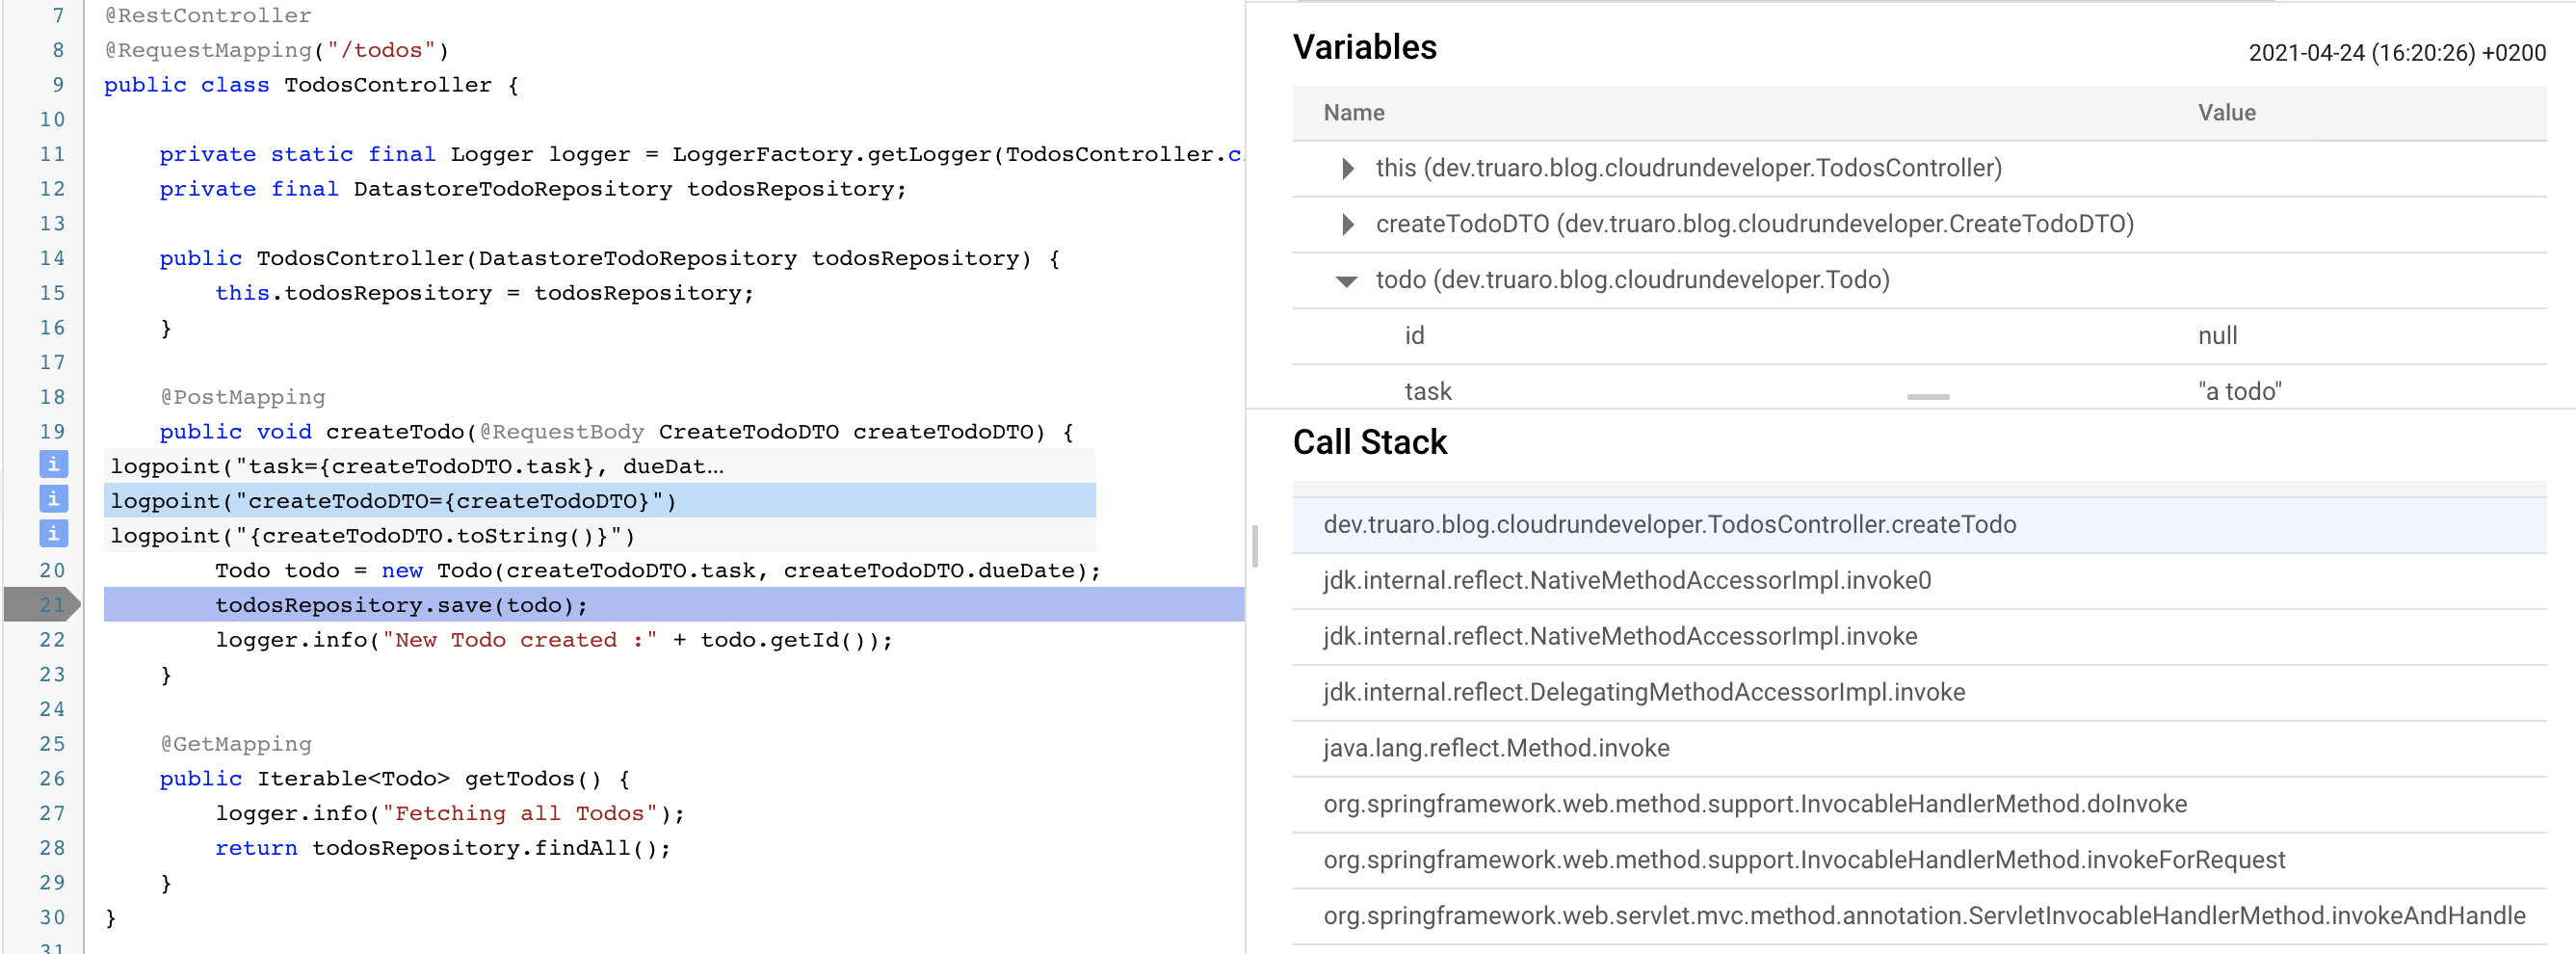
You can see 2 interesting panels on the right side:
- Variables: Display the content of
this, your method parameters and the variables you created. - Call Stack: Display the stacktrace the lead you to your current snapshot.
Please note a snapshot does not stop your execution, it simply collects data, but does not affect the user experience.
- Be careful, the debugger is linked to a revision of your service. If you deploy a new revision, you will have to configure the Debugger to communicate with the new services.
- Besides, your application needs to be running before creating LogPoints and Snapshots, otherwise the debugger agents will not send data to the Debugger service.
Cloud Profiler
doc:
- https://cloud.google.com/profiler/docs/profiling-java#gke
- https://cloud.google.com/profiler/docs/profiling-java
Couples of information (installation with agents)
Installing the Agent
Just like Cloud Debugger, profiling an application requires the installation of the Profiler Agent in the OCI image deployed on Cloud Run.
Following this documentation, here is how you can install the agent:
# Create a directory for the Profiler. Add and unzip the agent in the directory.
RUN mkdir -p /opt/cprof && \
   wget -q -O- https://storage.googleapis.com/cloud-profiler/java/latest/profiler_java_agent.tar.gz \
   | tar xzv -C /opt/cprof
Then, when running your Cloud Run service, you need to provide environment variables to complete the Profiler agent setup. Here is a combination I found useful to monitor a Spring Boot application:
JAVA_TOOL_OPTIONS=-agentpath:/opt/cprof/profiler_java_agent.so=-cprof_service=<SERVICE_NAME>,-cprof_enable_heap_sampling=true,-cprof_cpu_use_per_thread_timers=true
-cprof_service=<SERVICE_NAME>: provide the name of the service that will be used in Cloud Profiler. Usually, use the same name as the Cloud Run service.-cprof_enable_heap_sampling=true: Enable Heap sampling. Only available for Java 11 and higher.-cprof_cpu_use_per_thread_timers=true: Samples the CPU times per thread more precisely. Can add a little overhead, but as you run your application with multiple threads, it can be a useful metrics to have.
Profiling your application
Cloud Profiler works by collecting profiles of your running application. The profile agent communicates with the Cloud Profile backend API and sends profiling data every minute on average.
The Profiler can manage different information:
- CPU Time: The most basic metrics every developer should be familiar with. It is the time spent by the CPU on your method execution. It doesn't calculate the time spent on other resources. Of course, if your application spent most of its time waiting for a resource, you might find that the CPU time does not reflect well your application execution process. That is why, you need other metrics to know how long a method took.
- Wall Time: The total amount of time spent between the method call until the method returns. The Wall time will always be higher than the CPU times, as it will also track the time you spent waiting for a resource.
- Heap memory usage:
- Heap: The amount of memory allocated in the program at a single point of time. It does not store the allocation during the program execution. To do so, there is the Allocated Heap metric.
- Allocated Heap: The allocated heap during the interval. Takes into account memory that has been allocated and memory that has been freed.
Unfortunately, not all metrics are available for all languages. For the full list of supported metrics, check the official documentation.
Data representation in Cloud Profiler UI
Before showing you a screenshot of the UI for my sample application, I think it is necessary to explain how the data is represented. The final representation is a Flame Graph, which is an optimized and space efficient visualisation suitable for displaying a large amount of information.
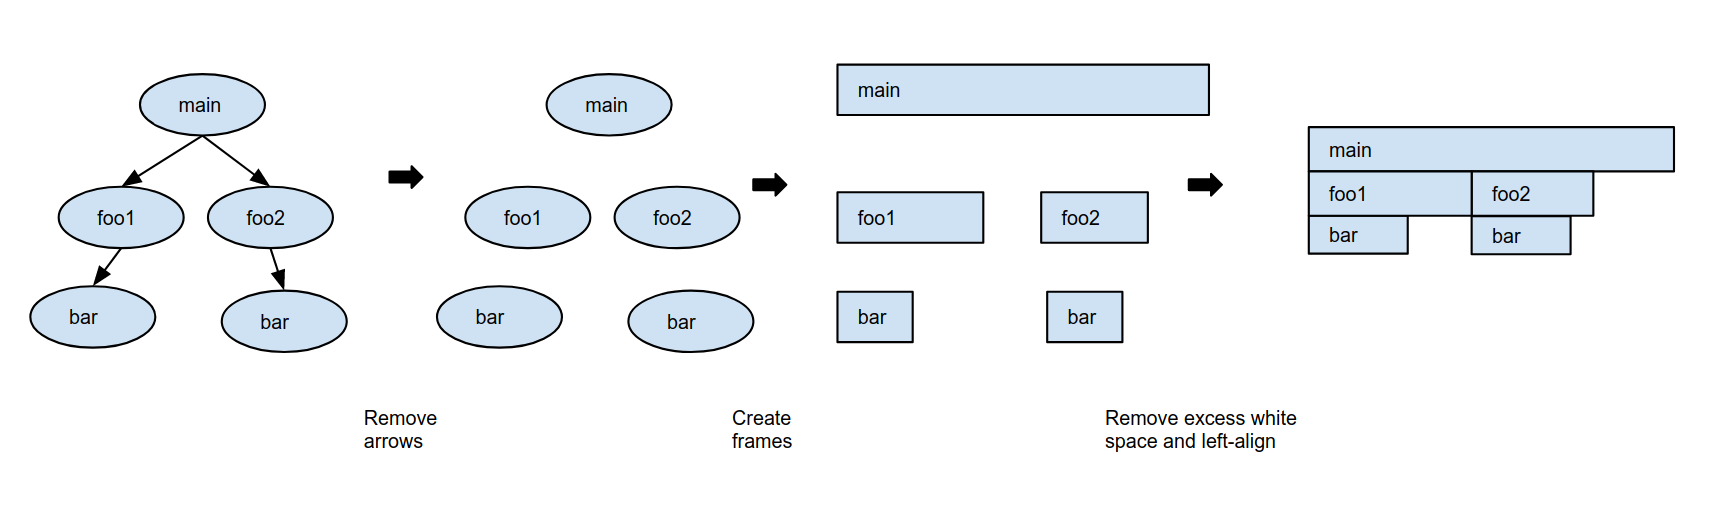
You can find more information in this documentation. It is unfamiliar at first, but once you are used to it, it is easier to read.
Example
In my example, I profile a Spring Boot Java 11 application. Therefore, I can only monitor:
- CPU Time
- Wall Time
- And Heap usage
I created a Controller designed specifically for time consuming resources. Here is the code of the Controller:
@RestController
public class TimeConsumerController {

   @GetMapping("/consume")
   public void consume() {
       for(int i = 0; i < 1000000; i++) {
           Random random = new Random();
           int i1 = random.nextInt();
           int i2 = random.nextInt();
           int i3 = i1 + i2 + i;
           System.out.println("i3 = " + i3);
       }
   }
}
A simple loop, that generates random numbers, sums them and displays the result in the standard output.
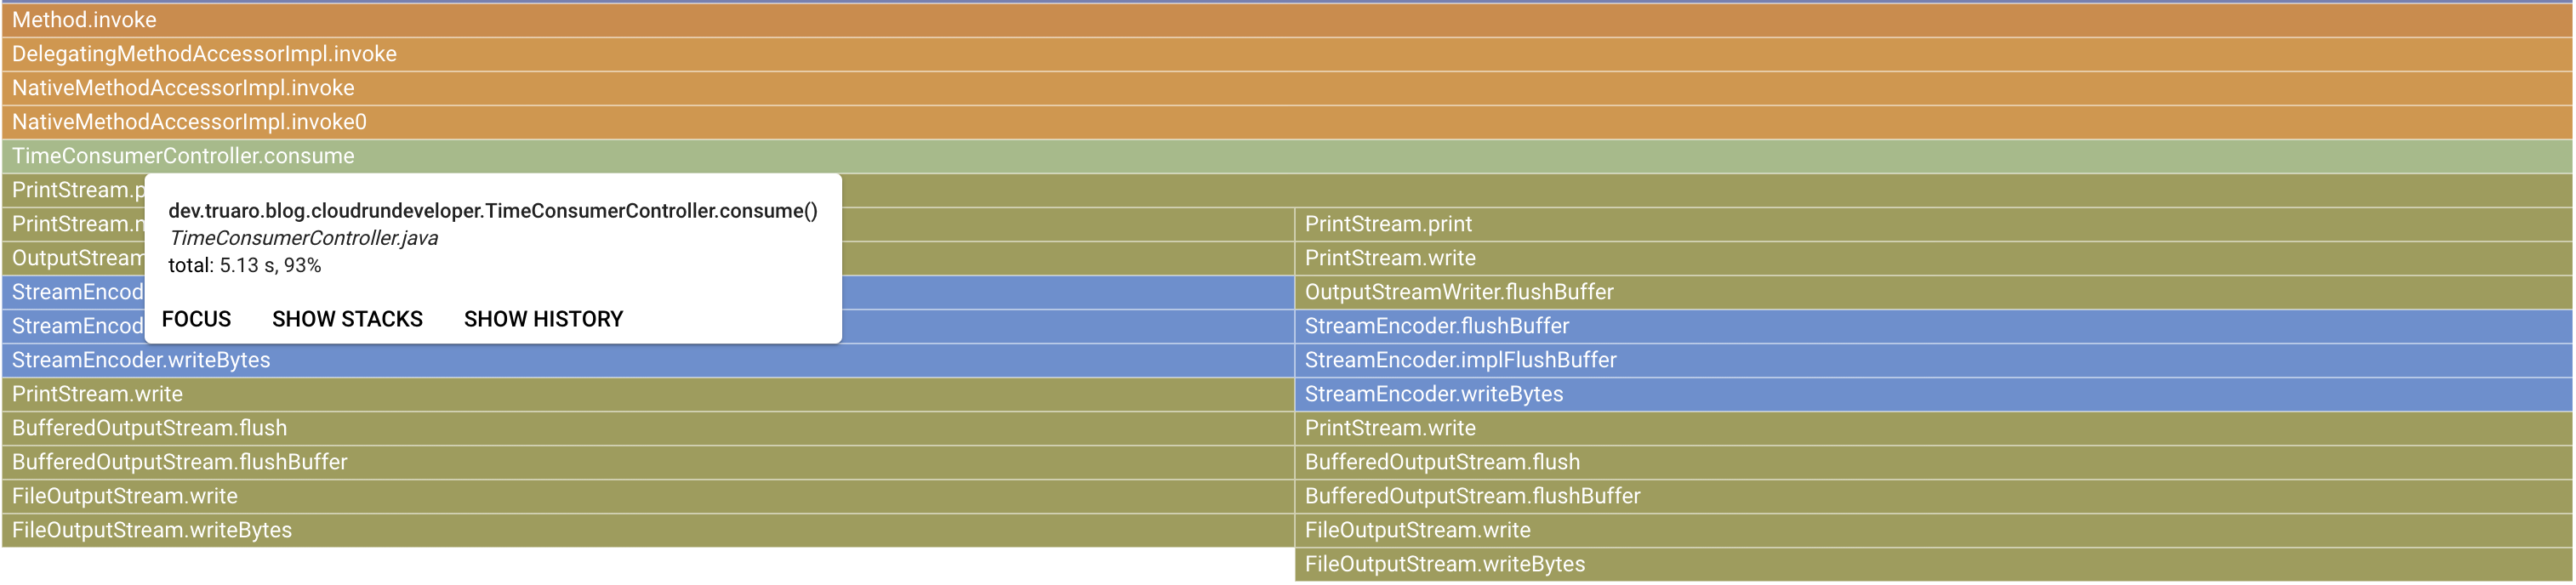
After a couple of API calls, I got the following CPU time graph:
As a reference, here is the Wall Time graph:
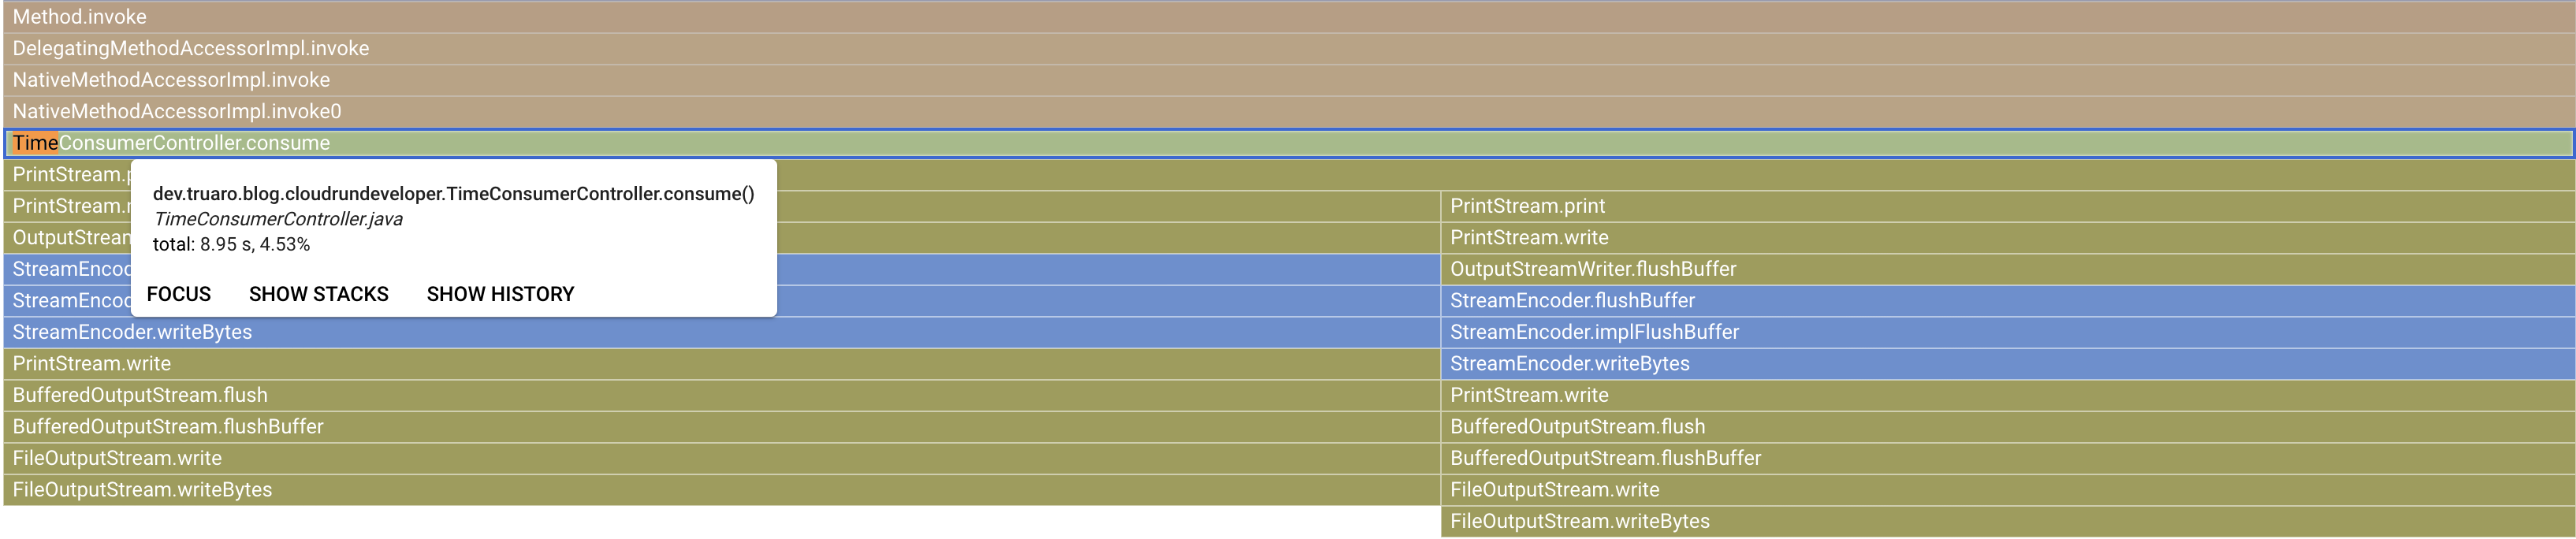
In terms of seconds spent on the method, the Wall Time is 8.95s and the CPU Time is 5.13s.
With an application dealing with multiple users, you could have more useful metrics and time spent in specific methods, helping identify bottlenecks.
IMHO, the Cloud Profiler with Spring Boot is not very practical to profile specific business code without the noise coming from the framework code. Indeed, I spared you from the global Profiler graph, but you mostly see framework related methods, which can make it harder to find bottlenecks in your business code.
Cloud Trace
The last service you need to know is Cloud Trace. Its purpose is to monitor the latency of your requests when users call your application. In a nutshell, latency is the time delay the user waits before receiving the response from your application.
This service is automatically configured to monitor your Cloud Run services, which makes it very easy to use. Here is a screenshot of the latency of several test requests I made.
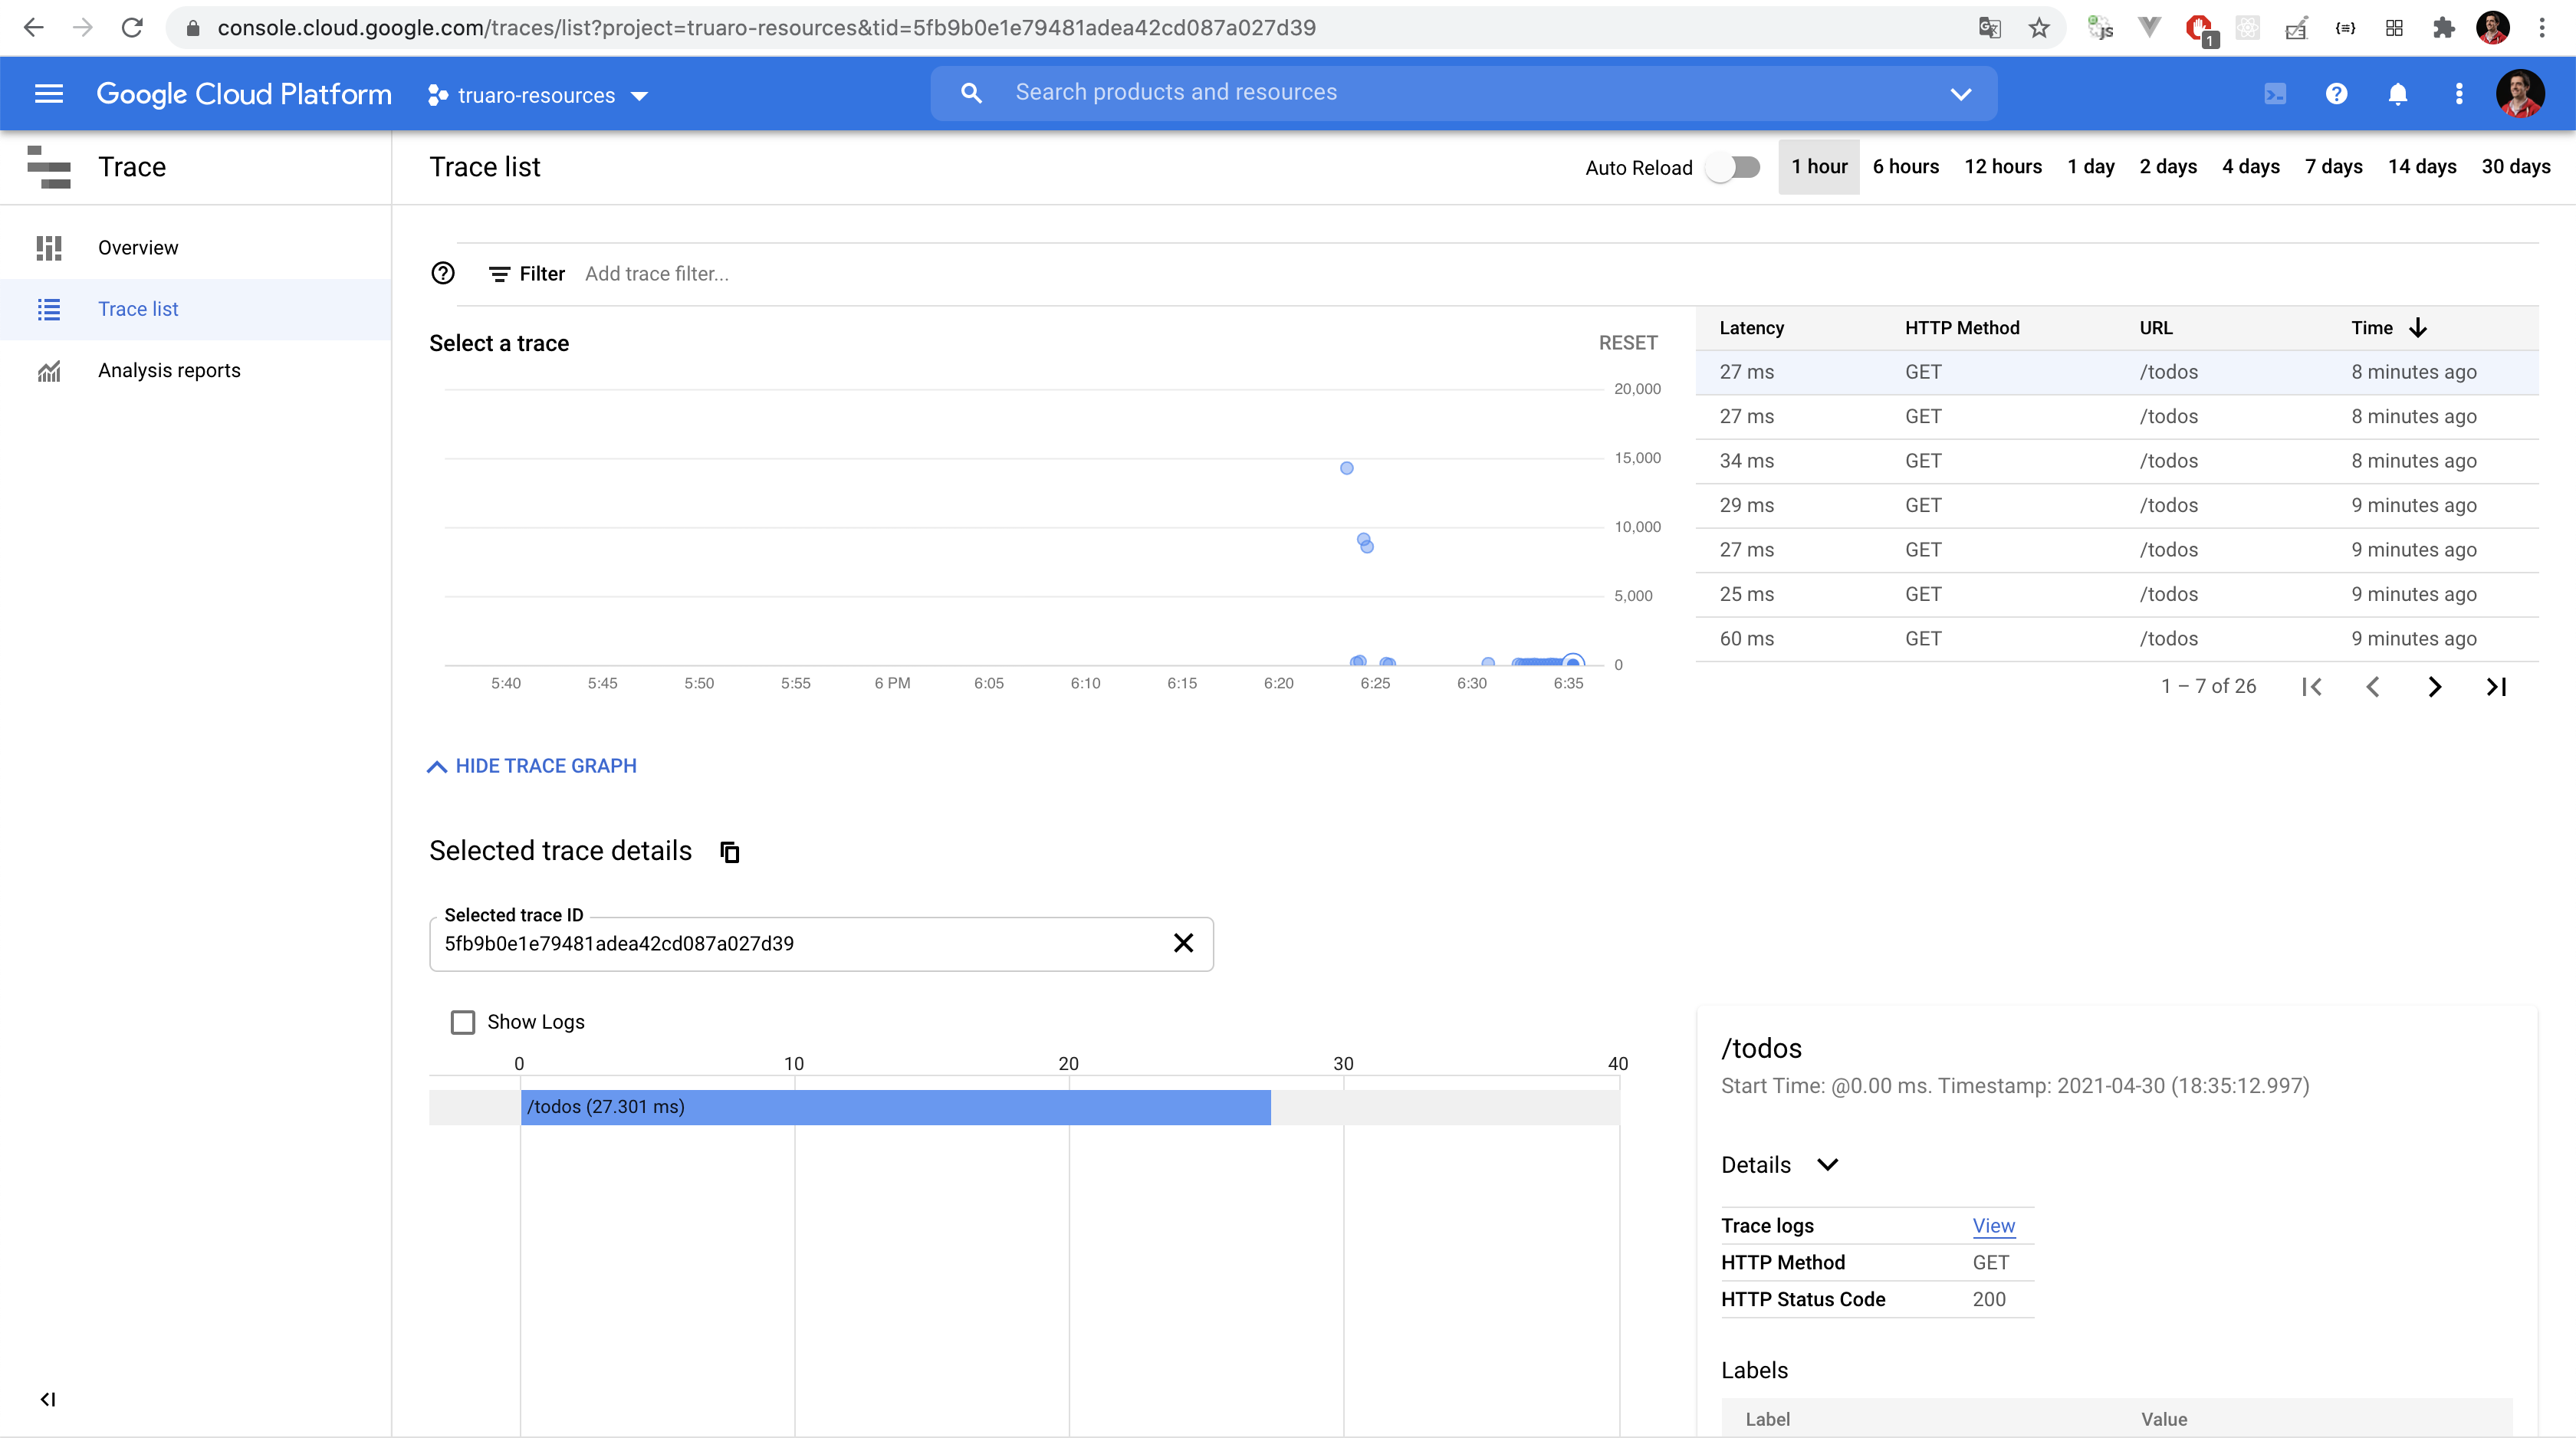
Parsing this graph is quite straightforward:
- The blue dots represents the latency of a request
- You can see the request with the longest latency took 15 seconds. This request started the Cloud Run service, which is why it took so long
- You can see some requests taking around 10 seconds. These requests were hitting the
/consumeAPI (remember the API I created earlier ?) - For most of the requests, it took around 50ms to handle a GET on
/todos, which is great. It means the user almost never waits for requests going through your Cloud Run and Datastore.
Of course, by default, not all requests are logged. Doing so would increase data volume greatly, and your usage bill at the same time. Instead logs are sampled and only a subset of them are collected.
Cloud Trace offers other features that are not detailed here, like:
- Building insightful graph to accurately monitor your application
- Monitoring outgoing requests made by your application to another application to calculate the global latency
- Exporting the data to aggregate your trace the way you need
- Providing data about the user who generated the request, like its country, its region, its city...
The tool I used to generate some traffic is siege, a Linux tool to generate concurrent traffic on an endpoint. Here is the command line I used:
siege -c 3 https://...
Conclusion
I hope you have a better view of some developer tools that could make your life with Cloud Run easier. To go further, there are other tools focused on latency and error reporting. Please, find the list of the resources we went through together below:
